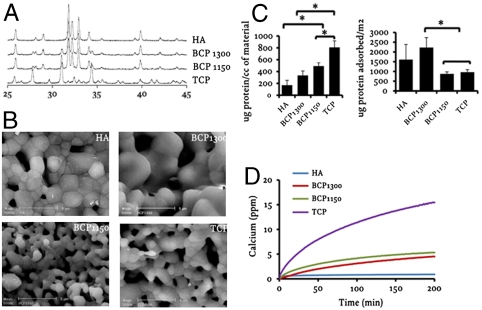
Fig. 1.
Characterization of calcium phosphate ceramics. (A) XRD analysis showing the composition of the four different ceramics with their characteristic peaks indicated. (B) Environmental SEM photographs depicting their microstructure. (C and D) Protein adsorption and calcium release profile of the different ceramics, respectively. The error bars represent standard deviations. An asterisk (*) denotes statistical difference (one-way Anova and Tukey’s test, P < 0.05).

