Fig. 1.
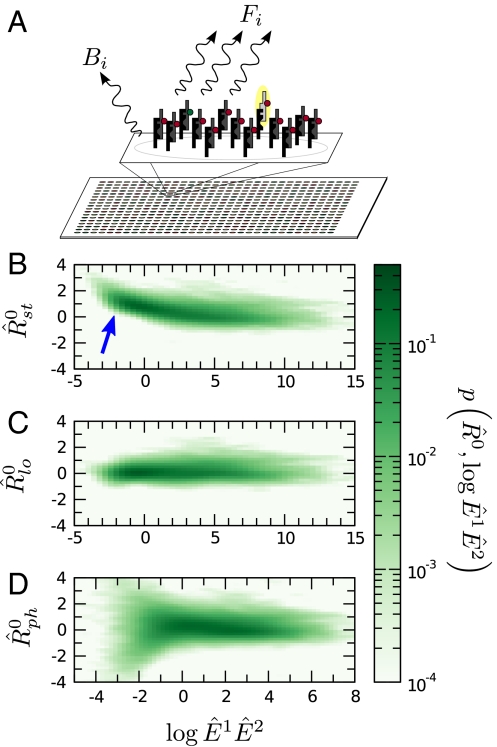
(A) Schematic of a microarray chip. Two quantities are typically reported for each spot in a two-color microarray experiment: the median feature fluorescence Fi and the median nonfeature fluorescence Bi. The total feature intensity is constituted by the sum of intended specific associations between probe and target (dark gray), as well as any number of nonspecific interactions (light gray). Because the nonfeature region has no probes attached, it is unreasonable to assume that Bi can provide reliable information on the nonspecific hybridization occurring in the feature region. (B–D) Single chip-wide joint probability distributions of  and
and  for an A. thaliana chip (19) (GEO accession no. GSM133484). (B) A plot of
  against
  is equivalent to the “MA” plots commonly used to diagnose bias in microarray data.
  estimates from the statistical model (Eq. 2) depend strongly on
  , particularly for small
  (blue arrow). This bias is absent from data adjusted using (C) the scatterplot smoothing routine lowess and (D) from estimates derived from our physically grounded model.

