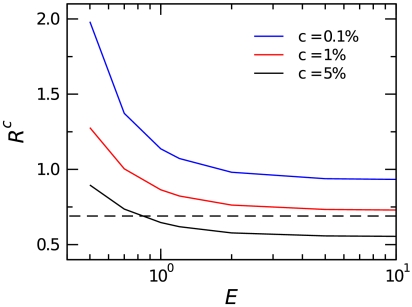
Fig. 5.
Null model for expression change. By deriving the distribution p(R0|E), we can establish a confidence interval such that p(Rc∈R0|E1 = E2 = E) = 1 - c (Fig. S5). The likelihood of a particular R falling outside this confidence interval is small if the expression is not changed. This allows us to quantitatively identify genes with statistically significant expression changes. Genes with low expression have larger confidence intervals because nonspecific binding noise is more important to the estimates for these genes than for highly expressed genes. The dashed line denotes the “twofold change” traditionally used to determine significance in microarray experiments. The appropriate value of c should be dictated by an appropriate false discovery rate controlling procedure (20–22).

