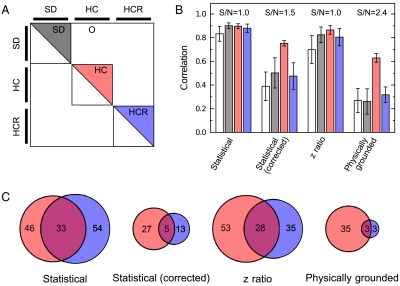
Fig. 6.
Enrichment of gene lists. (A) To understand the practical implications of our model, we computed correlation between pairs of estimates of different feeding protocols. These pairs of chips can be divided into four qualitatively different sets. (B) Correlations between expression change estimates calculated using the standard model (white) are high between replicates, even in SD experiments (5), resulting in weak statistical power (Fig. S7). This makes it difficult to establish that the difference between HCR and SD feeding regimens is small relative to the difference between the HC and SD regimens. In contrast, correlations between expression changes calculated using our physically grounded model (gray) have weak correlations between SD replicates, strong correlations between HC replicates, and weak correlations between HCR replicates. This conclusively indicates that the differences between HCR and SD transcriptomes are on the same order of technical noise, while there is a robust difference between HC and SD transcriptomes. (C) Consistent sets of genes up- and down-regulated genes (which we have combined for simplicity) for HC (red) and HCR (blue) chips. As expected, HCR sets derived from our physically grounded model have very little overlap because few genes have changed expression. Likewise, very few genes are common to both the HC and HCR sets, indicating that they are distinct expression patterns. S/Ns are calculated as the ratio of the mean correlation of the HC chips to the SD chips.

