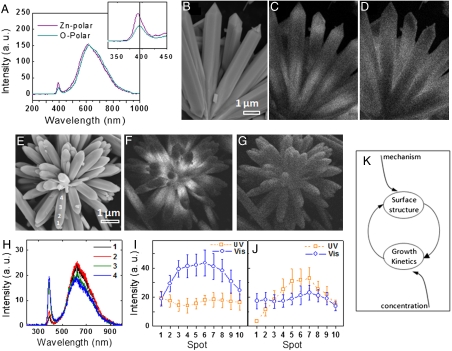
Fig. 3.
(A) CL spectra acquired from an O-polar and a Zn-polar assembly. (Inset) Highlights the UV emissions. (B–D) SEM and CL images corresponding to emissions at 390 nm and 600 nm, respectively, for a Zn-polar assembly. Similar images recorded on an O-polar assembly are shown in E–G. (H) CL spectra taken along a ZnO arm, seen in E showing that the visible emission remains consistent while the UV emission intensity gradually changes. (I and J) Plots showing systematic variation of UV and visible emission intensities across Zn-polar and O-polar assemblies (from tip to the base), respectively. (K) Schematic showing the various factors, e.g., reaction mechanism, reactant concentrations and interdependent growth kinetics, and surface structures, that instill systematic variation in properties inside each assembly.

