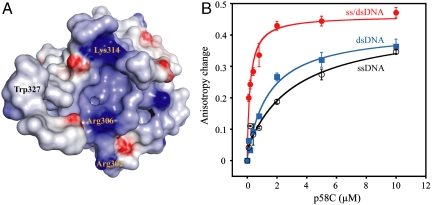
Fig. 2.
Binding of DNA by p58C. (A) Molecular surface of p58C colored on the basis of electrostatic field potential (red, -7 kBT; blue +7 kBT) with the positions of Arg302, Lys314, and Trp327 highlighted. (B) Plots of increase in fluorescence anisotropy as a function of p58C concentration for labeled 12-mer ssDNA (open black circles), 12-mer dsDNA (closed blue squares), and ss/dsDNA junction with 12 base-pair duplex (closed red circles).

