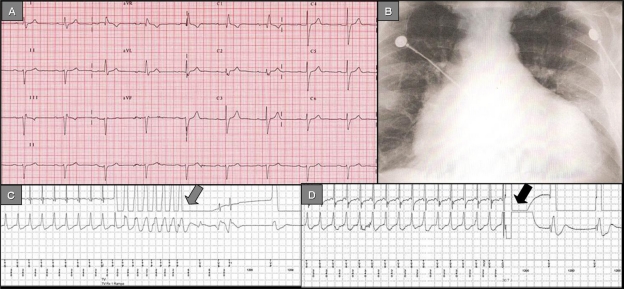
Figure 1.
Panel A) 12-lead ECG depicting the typical conduction disorders associated with Chagas’ disease: Right bundle branch block, left anterior fascicular block, 1° AV block. Panel B) Chest X-ray (antero-posterior view): Increased cardiothoracic index, vascular cephalization. Panel C) ICD stored electrogram depicts VT successfully terminated by antitachycardia pacing (grey arrow). Panel D) ICD stored electrogram depicts VT successfully terminated by a shock (black arrow).

