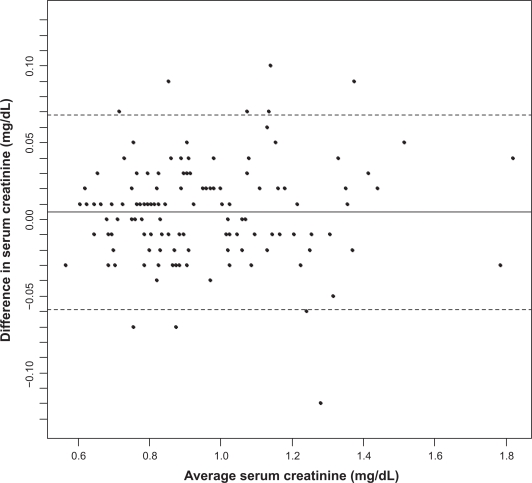
Figure 1.
Bland–Altman plot comparing serum creatinine (mg/dL) measurements from Fairview and Cleveland Clinical Laboratories on n =134 subjects with paired measurements.
Notes: x-axis: mean of the two serum creatinine (mg/dL) measurements (Fairview + Cleveland Clinic/2). y-axis: Difference of the two serum creatinine (mg/dL) measurements (Fairview − Cleveland Clinic). Solid line represents mean serum creatinine level (mg/dL). Dotted lines represent ±2 standard deviations around the mean serum creatinine level (mg/dL).

