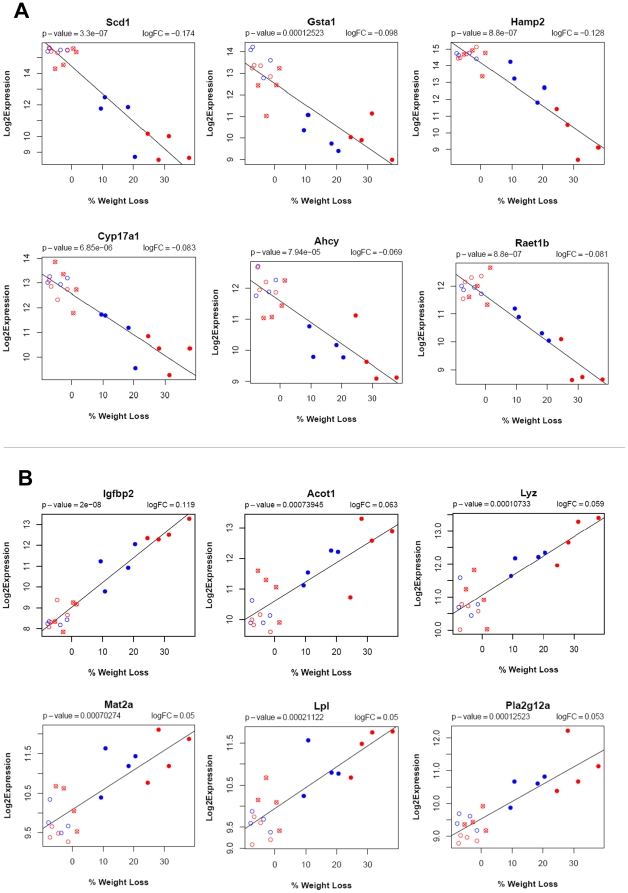
Figure 2. Regression plots of top six downregulated and top six upregulated genes.
The regression analysis was performed using “LIMMA” to identify genes whose expression is significantly correlated with leptin mediated weight loss. Blue open circle is vehicle subcutaneous treatment; Blue filled circle is leptin subcutaneous treatment; Red open circle is vehicle intracerebroventricular treatment; Red filled circle is leptin intracerebroventricular treatment; Red crossed circle is leptin intracerebroventricular treatment but no weight loss.

