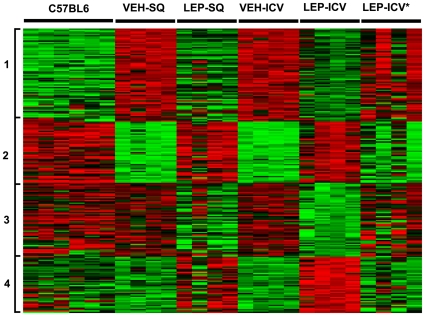
Figure 3. Heatmap of 214 differentially expressed genes showing gene expression levels across different samples.
Each row represents one gene and each column represents one sample. Red indicates higher expression and green indicates lower expression. The global gene expression profiles were compared after the central and peripheral leptin treatments in ob/ob mice, while C57BL6 mice were used for the baseline gene expression. Cluster analysis on the gene expression data was performed to group the genes with similar expression patterns across experimental conditions. VEH-SQ: vehicle subcutaneous treatment, LEP-SQ: leptin subcutaneous treatment, VEH-ICV: vehicle intracerebroventricular treatment, LEP-ICV: leptin intracerebroventricular treatment, LEP-ICV*: represents four animals in which the cannula may not have been in place or treatment failed. While analyzing the phenotype data, we found that there was no weight loss in these four animals. Sectioning of the brain could not confirm placement of the cannula in these animals. The expression of these animals is very similar to the vehicle treated animals.

