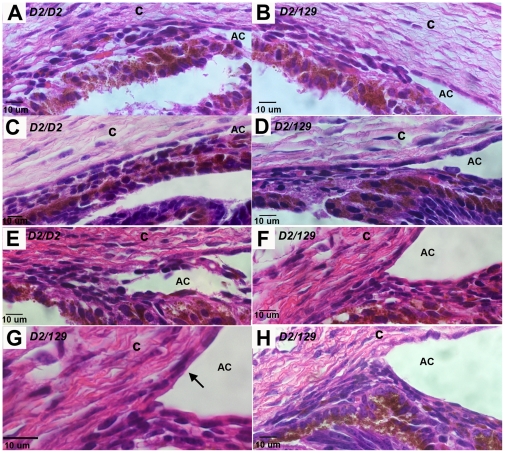
Figure 4. Development of the mouse PPCD1 phenotype.
The iridocorneal angle from normal eyes (A, C, and E) is compared with that of PPCD1 littermates (B, D, F, and G). Panel H shows the PPCD1 iridocorneal angle at P5. Genotypes are indicated at the upper left. D2, DBA/2J; AC, anterior chamber; c, cornea. A. Normal, P0. B. PPCD1, P0. C. Normal, P2. D. PPCD1, P2. E. Normal, P3. F. PPCD1, P3. G. PPCD1, P3, enlarged to show layering of corneal endothelial cells (arrow). H. PPCD1, P5.

