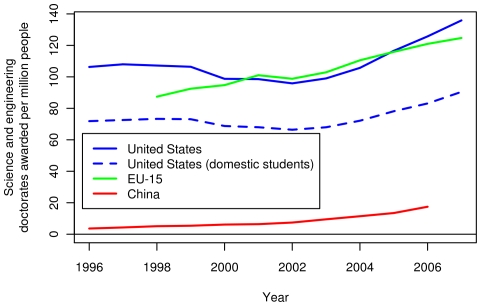
Figure 10. Per capita science and engineering doctoral awards in the US, the EU-15 and China.
The solid lines show the number of doctoral degrees granted per capita by institutions in the US, the EU-15 and China. In addition, the dashed line shows the number of doctoral degrees granted per capita by the US institutions to the US citizens and permanent residents. Per capita figures were divided by the population of the region.

