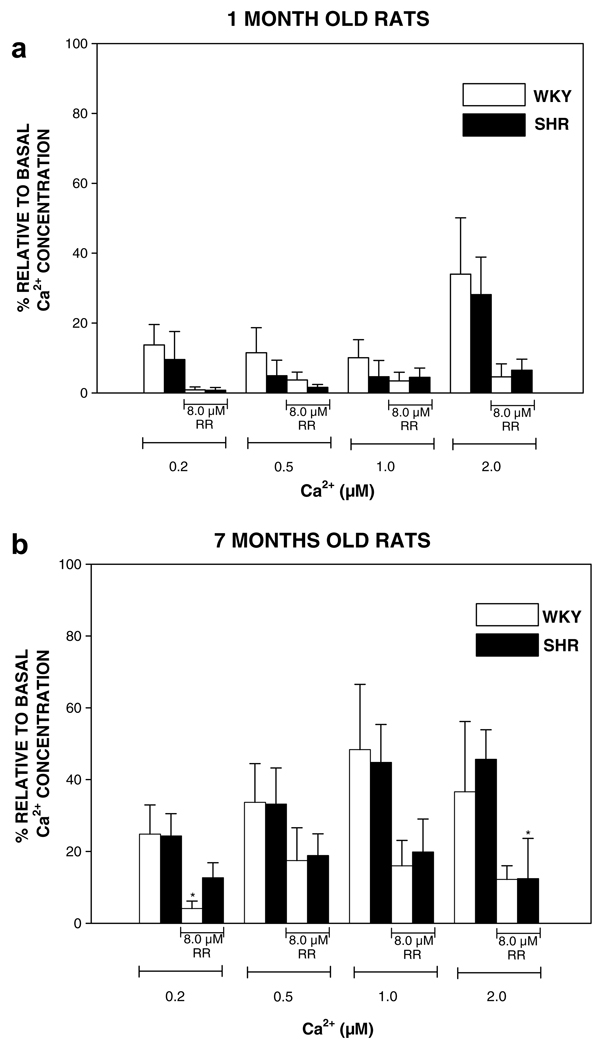
Fig. 1.
Measurement of free intramitochondrial Ca2+. Free mitochondrial Ca2+ concentration was followed spectrofluorometrically with Fluo-3/AM as indicator. (a and b) One- and 7-months old rats, respectively. Eight micromolar Ruthenium red (RR) was added to mitochondria. Several different concentrations of free Ca2+ were added (calculated with Winmax computer program) to mitochondria (0.125 mg/ml). Minimal and maximal fluorescence was determined by the addition of 0.6 mM EGTA/0.05% DOC and 5 mM Ca2+, respectively. Wistar Kyoto normotensive genetic control (WKY) and spontaneously hypertensive (SHR) rats were compared. Each point represents the mean ± SEM of 3–5 separate experiments. *p < 0.05 vs. respective control values.

