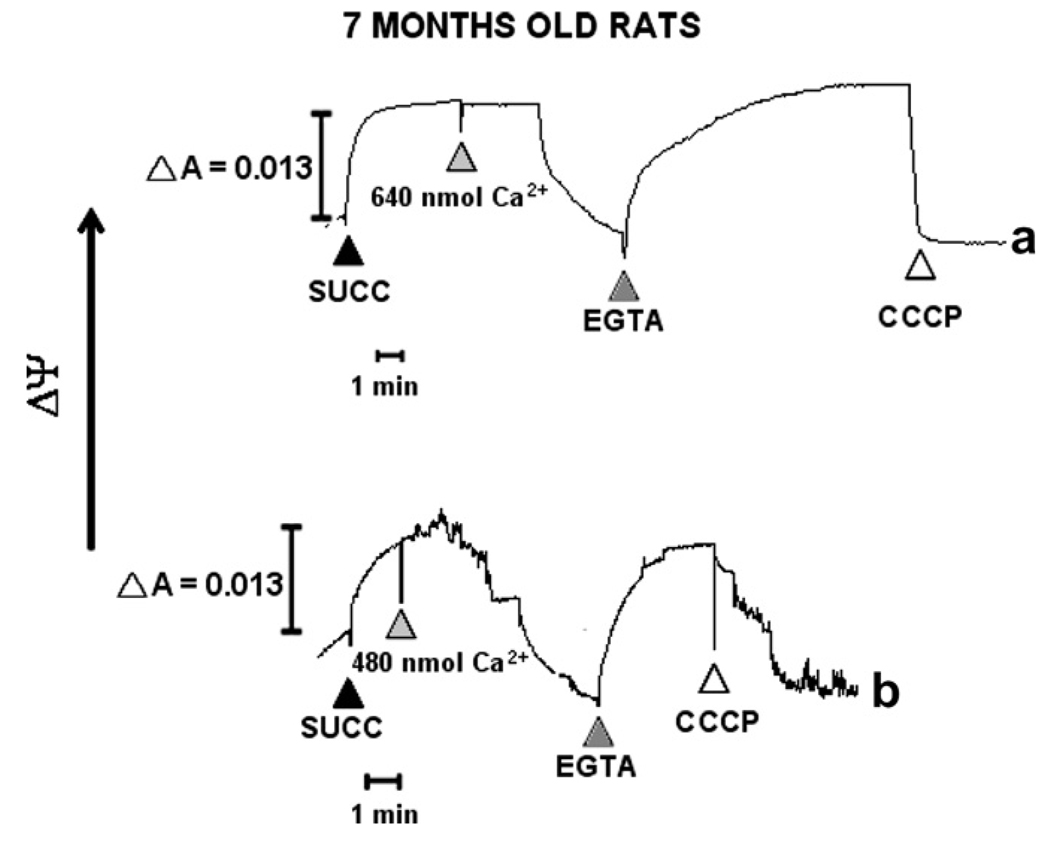
Fig. 5.
Mitochondrial membrane potential (mΔΨ) measurements. mΔΨ was followed spectrophotometrically with the indicator safranine. Mitochondria (0.3 mg/ml) were de-energized with rotenone (not shown) and subsequently energized with 10 mM succinate (▲ succ). After addition of 640 and 490, 160 nmoles Ca2+ to 7-months old WKY and SHR rats, respectively, and establishing a stable mΔΨ, 0.5 mM EGTA (▲) and CCCP (∆) (carbonyl cyanide m-chlorophenylhydrazone) were added to the mitochondria with collapsed mΔΨ. (a) WKY and (b) SHR rats were compared. Five separate experiments were carried out in duplicates. A representative trace is shown.

