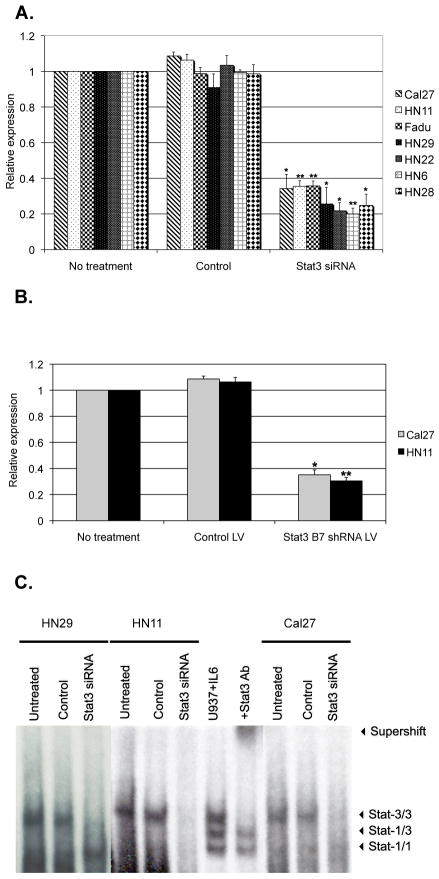
Figure 1.
STAT3 suppression in HNSCC cell lines. qRT-PCR demonstrated down-regulation of STAT3 mRNA by (a) siRNA treatment, as compared to no treatment or controls (scramble siRNA), or by (b) B7 shRNA lentivirus (LV) treatment, as compared to no treatment or control lentivirus. Histograms represent the means of at least three experiments normalized to mRNA expression of GAPDH. Data are presented as fold difference relative to control-untreated cell lines. * p <0.05; ** p <0.01. (c) STAT3 activation in tumor cells, as detected by EMSA. Stat-3/3, Stat3 homodimer; Stat-3/1, Stat3-Stat1 heterodimer, Stat-1/1, Stat1 homodimer. The STAT3 homodimer band in HN29, HN11and Cal27 cell lines decreased after treatment with STAT3 siRNA, compared to control. U937 stimulated with IL-6 represents the positive control (lane 7). Pre-incubation with an anti-STAT3 antibody shifts the STAT3 homodimer band (supershift band; lane 8).

