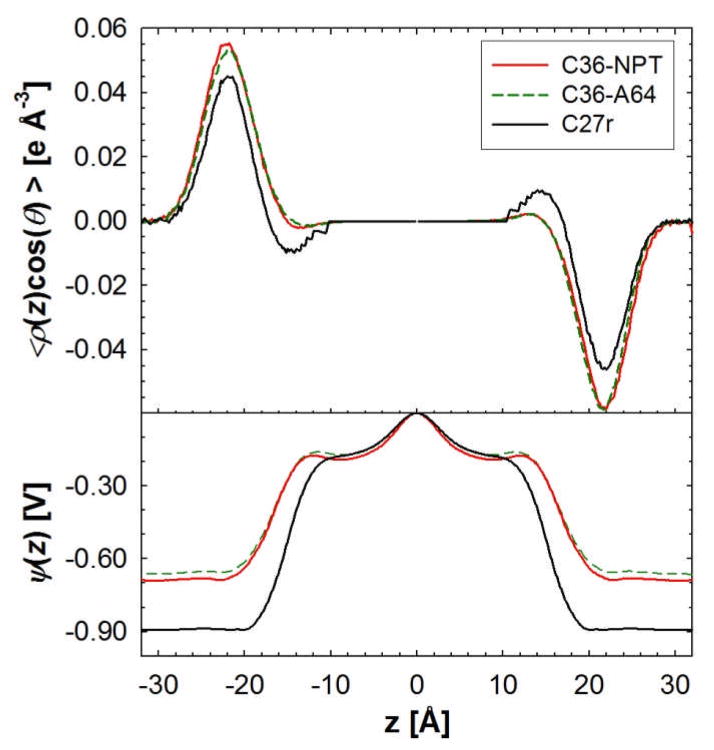
Figure 12.
(top) The orientation of the water dipole with respect to the positive z-axis, scaled by the electron density for the DPPC bilayer at constant surface (64 Å2/lipid, A64) and NPT simulations. Simulations with the C27r FF were run at NP(A=64)T. The electrostatic potential drop for the bilayer simulations is shown in the bottom panel.

