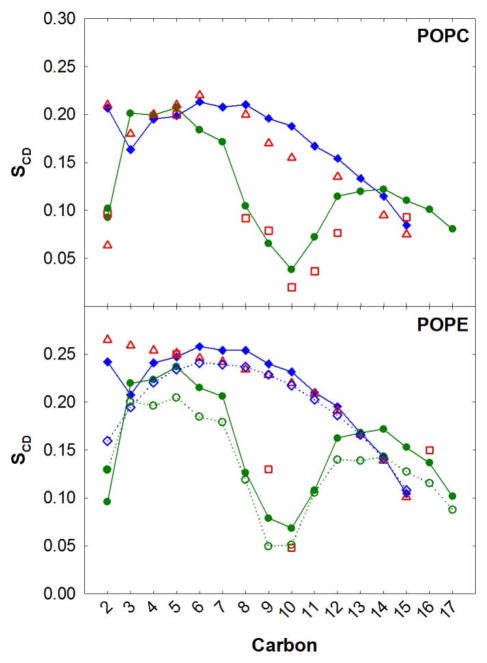
Figure 9.
NMR deuterium order parameters (SCD) for POPC and POPE bilayers. For the MD simulations the sn-1 and sn-2 chains are in blue and green, respectively. The solid lines are based on results from NPT simulations with C36 and the dashed lines based on NP(A=60)T with C27r for POPE. Experiment is shown in red: the sn-1 (308 K)98 chain is in open triangles and sn-2 (310 K)28 chain in open squares.

