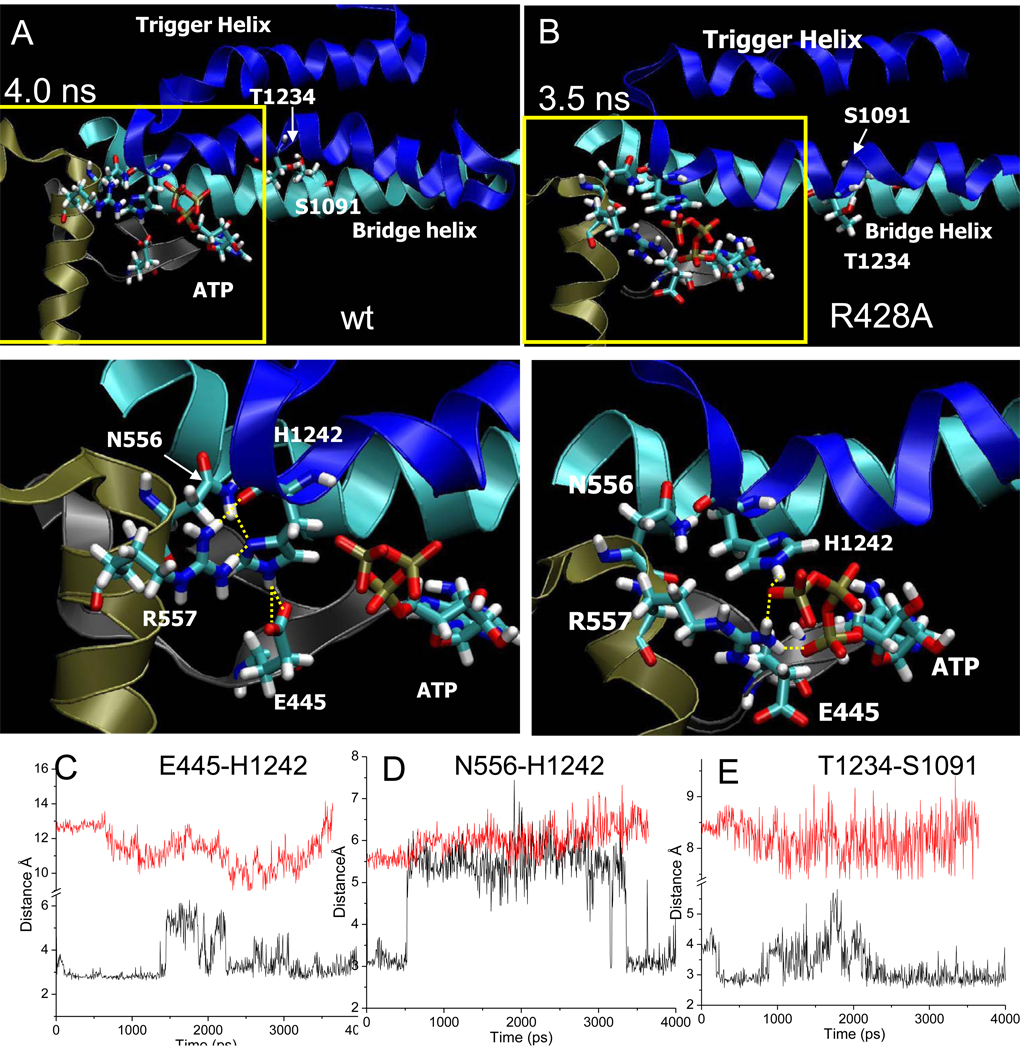
Fig. 5.
Wt latch and R428A RNAP active site conformations. A) Snapshot of wt RNAP at 4 ns. B) Snapshot of R428A RNAP at 3.5 ns. Trigger helices are dark blue. Bridge helix is cyan. Relevant residues are in stick representation. Lower panels are a magnification of the regions boxed in yellow. Yellow dotted lines indicate hydrogen bonding. C) β E445-P’ H1242 hydrogen bonding for wt (black) and R428A (red) RNAP. D) β N556-β’ H1242 hydrogen bonding for wt (black) and R428A (red) RNAP. For R428A RNAP, latch contacts do not form. E)βT1234-β’ S1091 (trigger helix to bridge helix) hydrogen bonding for wt (black) and R428A (red) RNAP.

