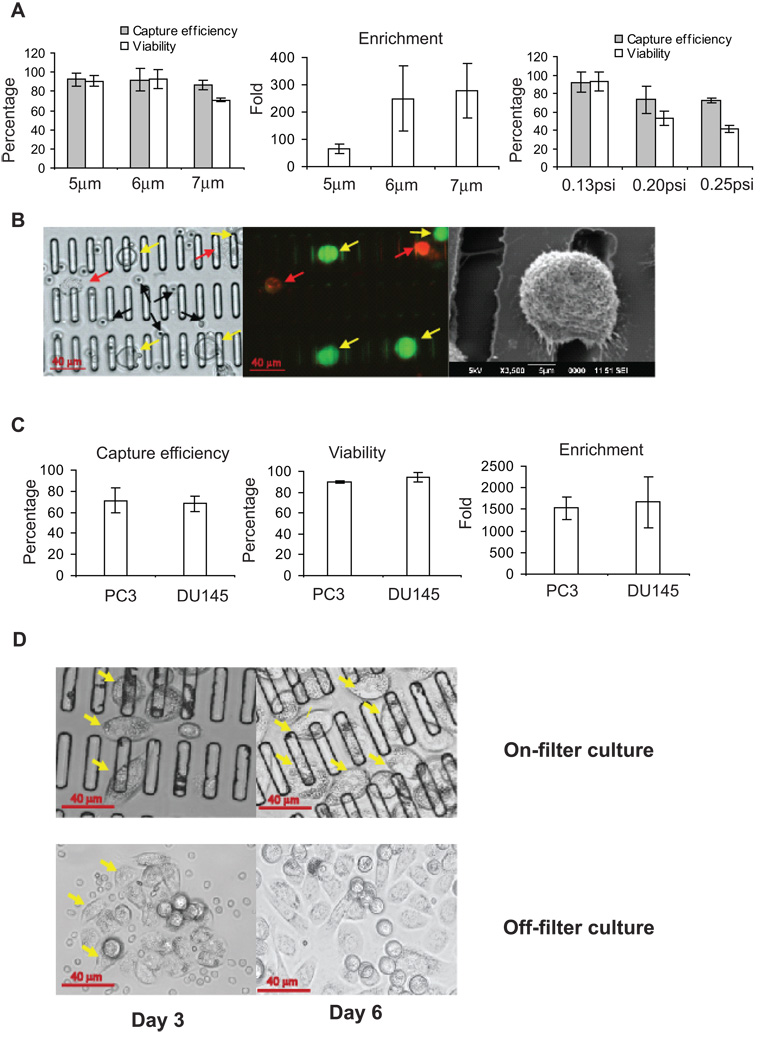
Figure 2. Microfilter optimization and validation.
(A). Slot size and filtration pressure optimization. Left: Comparison of cell capture efficiency and viability with different slot sizes. Center: Measurement of enrichment with different slot sizes. Right: Comparison of capture efficiency and viability with various filtration pressures using 6 µm slot filter. (B) Cancer cells captured on microfilter and imaged under bright-field (left) and fluorescence (center) of the same field; yellow arrows indicate live captured cancer cells, red arrows indicate dead cancer cells, and black arrows indicate PBMCs. Right: SEM of captured cancer cell. (C) Validation of cancer cell capture from 7.5 ml whole blood. Shown are capture efficiency (left), cell viability (middle) and enrichment (right). (D) On-filter (top) and off-filter (bottom) cell culture of PC3 cells captured from whole blood after 3 days and 6 days. Yellow arrows denote foci of cancer cell proliferation. All histogram results are means of triplicate independent experiments.

