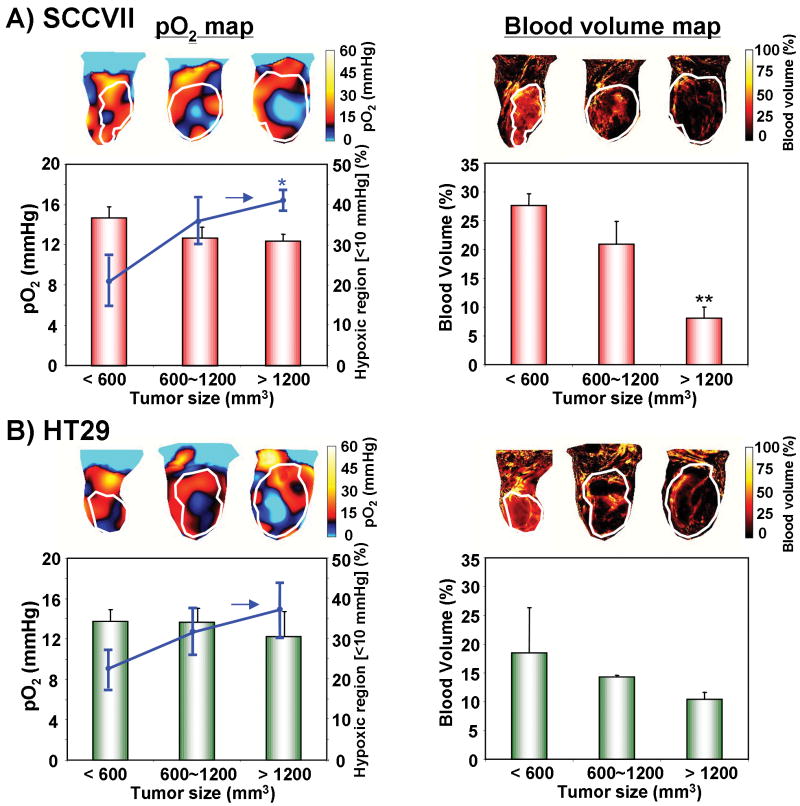
Figure 4.
The effects of tumor type and size on oxygenation and blood volume. Median tumor pO2 and the percentage of hypoxic region were estimated from EPRI in (A) SCCVII and (B) HT29 tumors. Representative pO2 maps at three tumor sizes are shown in the left upper panels. Tumor pO2 values from at least three tumors at each size are shown in red bar graphs (n = 3-4). The hypoxic volume, the percentage of the tumor volume having pO2 less than 10 mmHg, was plotted as a line superimposed on the bar graphs (n = 3-4). Blood volume images (right panels) were obtained from MRI studies using USPIO (n = 3-4).

