Figure 5.
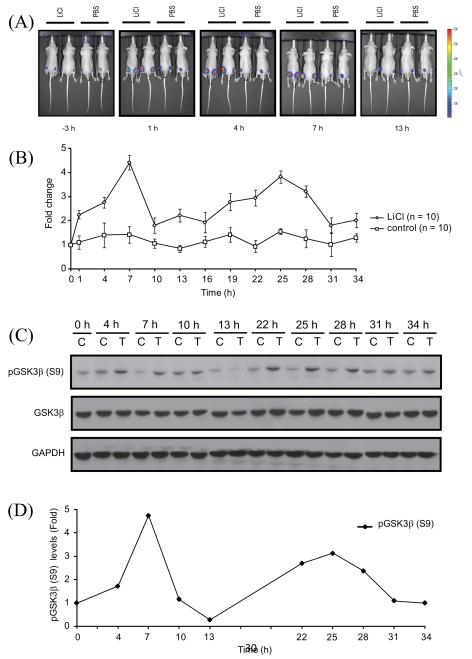
Imaging of GSK3β activity in vivo. (A) CD-1 nude mice were subcutaneously implanted with SW620 cells stably expressing the BGCR-WT reporter. BLI activity was monitored in mice after 2 weeks when tumors reached about 40-60 mm3 size. BLI activity of pretreated and treated with vehicle control (PBS) and LiCl (400mg/kg) was monitored at 3 h interval till 34 h. Representative BLI images at −3 h, 1 h, 4 h, 7 h, and 13 h were shown. All window and level settings were consistent for all the acquisition. (B) ROI were drawn manually above the tumors and peak bioluminescence was measured until 34 h post treatment. BLI activity was expressed as fold induction as means ± SEM for each of the groups, based on pretreatment level. (C) CD-1 nude mice harboring xenograft of BGCR-WT expressing cells were treated with vehicle control PBS (control, C) or treated with 400mg/kg LiCl (treated, T) and tumors were harvested at times points mentioned and western blot analysis was done with pGSK3β(S9), total GSK3β and GAPDH antibodies. (D) Densitometric analysis of pGSK3β(S9) western blot for vehicle treated and LiCl treated tumor was done and shown as fold change from control levels at each time point.

