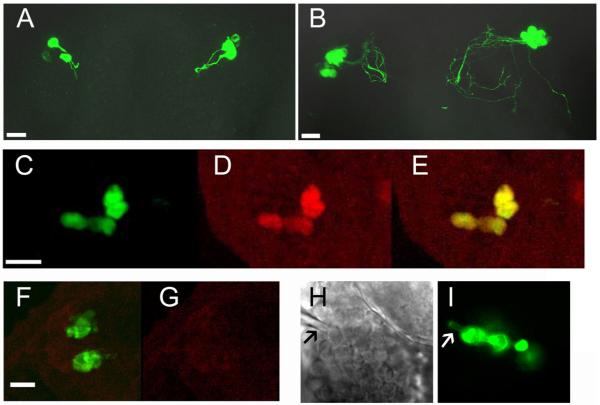
Figure 1.
Images of GnRH3:EMD neurons in zebrafish embryos. A, B: Confocal images of GnRH:EMD neurons in the olfactory region of live embryos. A: 27 hpf; B: 47 hpf (same embryo). Scale bar is 20 μm. C-E: Immunohistochemical (IHC) verification that EMD-expressing neurons in the olfactory region contain immunoreactive (ir) GnRH peptide. C: EMD fluorescence; D: irGnRH peptide; E: merged images of EMD and irGnRH. Scale bar is 50 μm. F, G: IHC control tissue in the absence of primary anti-GnRH antibody showing specificity of red fluorescence (i.e., irGnRH peptide). F: GFP fluorescence; G: IHC experiment in the absence of primary antibody. Scale bar is 10 μm. H, I: Verification that neurons targeted for whole-cell electrophysiology are EMD-containing neurons. H: Brightfield image of the intact brain in the olfactory region in the live embryo. I: EMD image (same field of view as in H) showing a string of GnRH3:EMD neurons in the olfactory region. EMD diffuses into the tip of the electrode (marked by arrow) during whole-cell recording (I).

