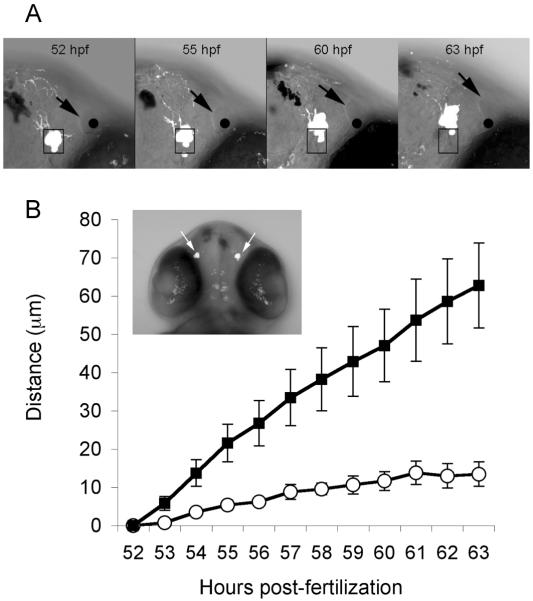
Figure 2.
Displacement of GnRH3:EMD neurons in the live, intact embryo at 2 dpf. A: Merged fluorescence and brightfield confocal images (single optical slice) from the same field of view at different times during development. Shown are representative images of the right upper quadrant of an embryo head over time (same embryo as shown in panel B insert). A box was positioned around the right GnRH3:EMD neuron cluster and a black dot was positioned at the center of the opening of the right nare at 52 hpf. The position of the box and dot were kept constant, relative to the field of view in subsequent images, revealing displacement of the GnRH3:EMD cluster and nare over this time period. Black arrows point to the edge of the opening of the nare. B: Displacement of GnRH3:EMD clusters from 52 – 63 hpf (mean ± SEM; four clusters from two embryos). Y-axis refers to distance moved relative to the location of clusters at 52 hpf. Displacement in an anterior direction is shown by the black squares; displacement in a lateral direction is shown by the open circles. The insert shows the entire head of the embryo (projection of the z stack) at 52 hpf; arrows point to the bilateral TN-GnRH3:EMD neuron clusters.

