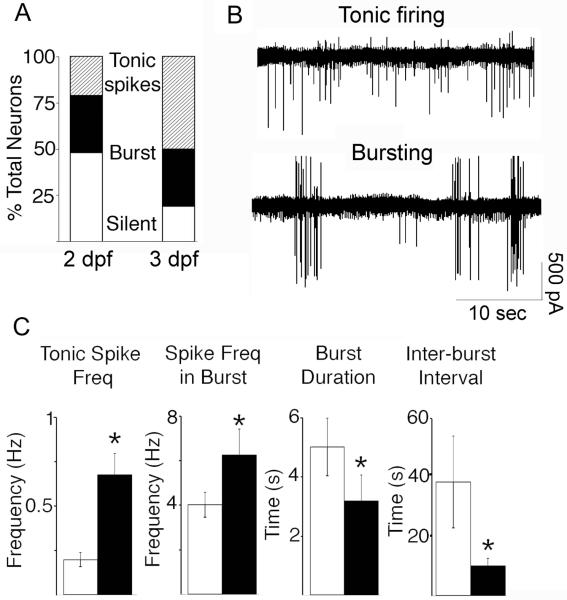
Figure 4.
Loose-patch electrophysiology recordings from 2 dpf (n=29 cells from 17 embryos) and 3 dpf (n=26 cells from 15 embryos) transgenic embryos. A: Percent of total TN-GnRH3:EMD neurons that were either electrically silent or showed very few action currents during the period of recording, showed a bursting pattern of action currents, or showed a tonic pattern of action currents. B: Representative traces from neurons that showed a tonic or bursting pattern of firing. C: Comparison of characteristics of electrical activity between 2 dpf (white bars) and 3 dpf (black bars) embryos (mean ± SEM). From left to right: frequency of tonic firing; frequency of firing within each burst; duration of the bursts; and, inter-burst interval. Asterisks denote statistically significant differences between age groups.

