Fig. 4.
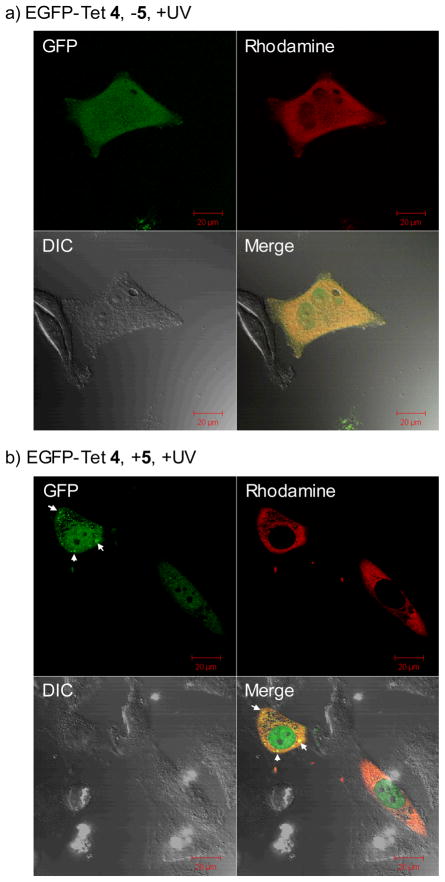
Representative cofoncal micrographs illustrating a bioorthogonal chemical control of the subcellular localization of EGFP in live HeLa cells in the absence (a) and presence (b) of lipid dipolarophile 5 in the culture medium: HeLa cells were microinjected with 25 μM EGFP-Tet 4 together with 2 μM Dextran-TMR, which was used as a red fluorescent marker that is excluded from the nucleus when injected in the cytoplasm. The images were acquired on a confocal microscope with GFP (green), Differential Interference Contrast (DIC), and rhodamine (red) channels following 1 min 302-nm UV irradiation. The merged cell images were shown as the last panels. The scale bars denote 20 μm.

