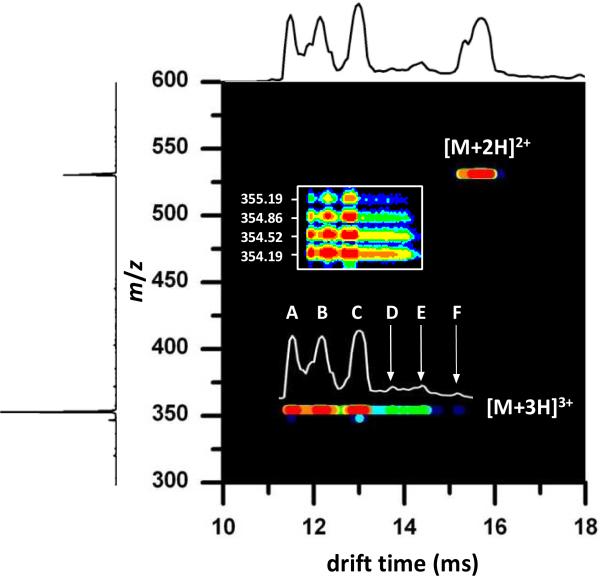
Figure 2.
Two-dimensional nested drift time(m/z) plot showing the [M+2H]2+ and [M+3H]3+ charge states of bradykinin. The total ion drift time distribution shown across the top is obtained by integrating across the entire m/z range for each given drift time. The mass spectrum shown on the left is obtained by integrating across all drift times for each m/z value. The [M+3H]3+ conformation assignments of A, B, C, D, E, and F are shown in the drift distribution above the 2D features. The inset shows an expansion of the m/z axis in the m/z 354 region; the isotopic distribution of the bradykinin [M+3H]3+ ions is shown. The data were collected using a He buffer gas pressure of ~3.0 Torr.

