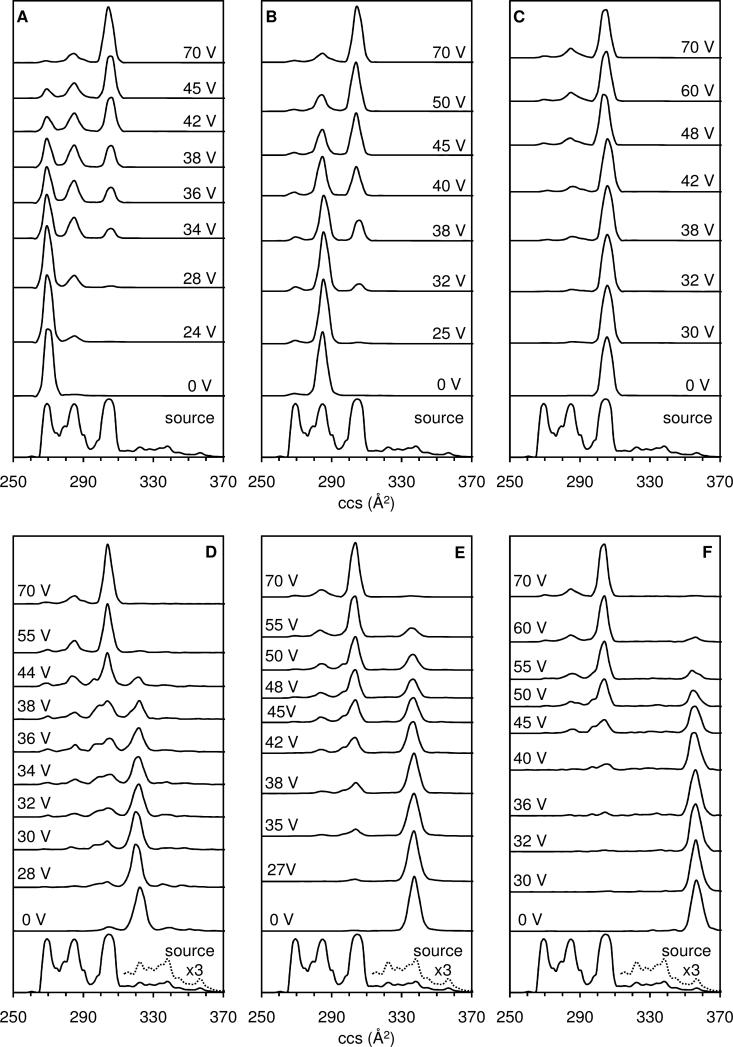
Figure 3.
Drift profiles of the [M+3H]3+ bradykinin ion plotted on a collision cross section scale. The bottom trace in each panel shows the ESI source distribution obtained for the dataset shown in Figure 2. The intensity of a portion of the ESI source distribution is multiplied by a factor of 3 in the bottom panels to show the features corresponding to conformations D, E, and F. Each panel shows one of six separate experiments (A-F) beginning with the initial selection (no activation) followed by increasing activation voltages up to 70 V. The areas under the selection and activation collision cross section distributions are normalized to unity. For the selection experiments represented in this Figure, the He buffer gas pressure was maintained at ~1.9 Torr. Selections of conformations A through F all converge to the same quasi-equilibrium distribution of A, B, and C at 70 V. See text for discussion.

