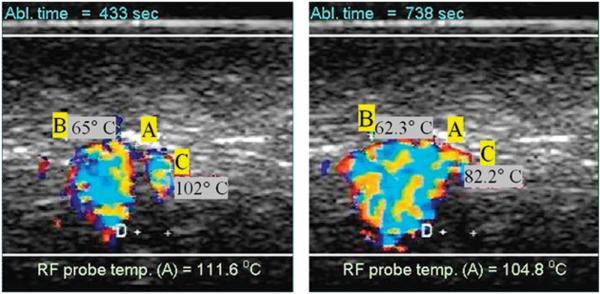
Figure 3.
Example of observed colour Doppler ultrasound signals (DUS) superimposed on B-mode images. The two images shown were taken at different times during an RFA ablation experiment using the needle probe. The letter A indicates the location of the RFA probe while letters B and C denote thermocouple locations (2mm apart as measured with the scanner).

