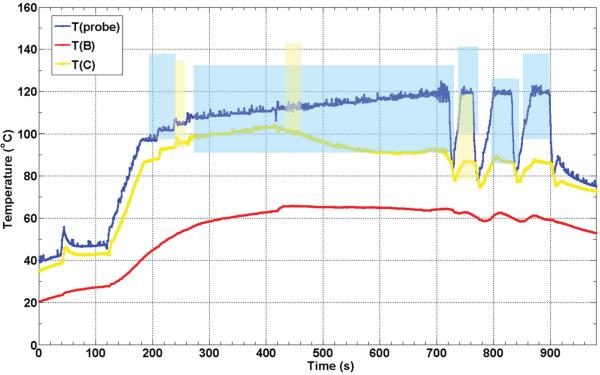
Figure 5.
Thermocouple recorded temperature histories during an ex vivo RFA experiment in turkey breast muscle. The colour-coded shaded areas denote the times and temperatures of observed sustained Doppler activity for the respective thermocouples (e.g. blue shaded area corresponds to temperatures as function of time measured at the probe). The positions of the RFA probe (A) and thermocouples B and C are as shown in Figure 3.

