
Figure 5. Western blot analyses of parkin levels in striata [A] and inferior frontal gyri [IFG] [B] from control, PD and PDD groups.
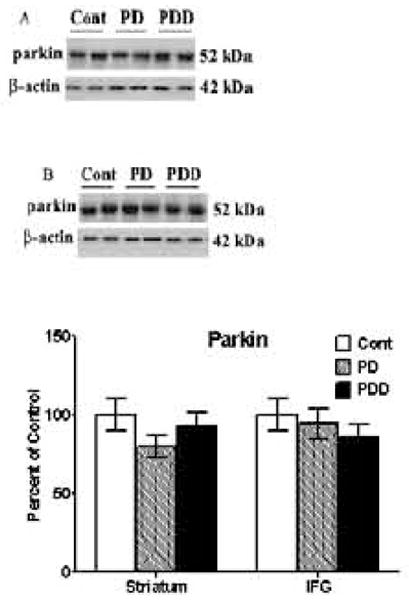
Western blot analyses of parkin levels were conducted using antibodies to detect parkin. Blots are from representative experiments, while the graph is a summary of quantitation of protein levels normalized against β-actin in samples, from striata of 17 PD cases, 18 with PDD and 22 controls and IFG from 9 PD cases, 7 PDD and 9 controls.