
Figure 7. Western blot analyses of 19S and 20S levels in striata [A] and inferior frontal gyri [IFG] [B] from control, PD and PDD groups.
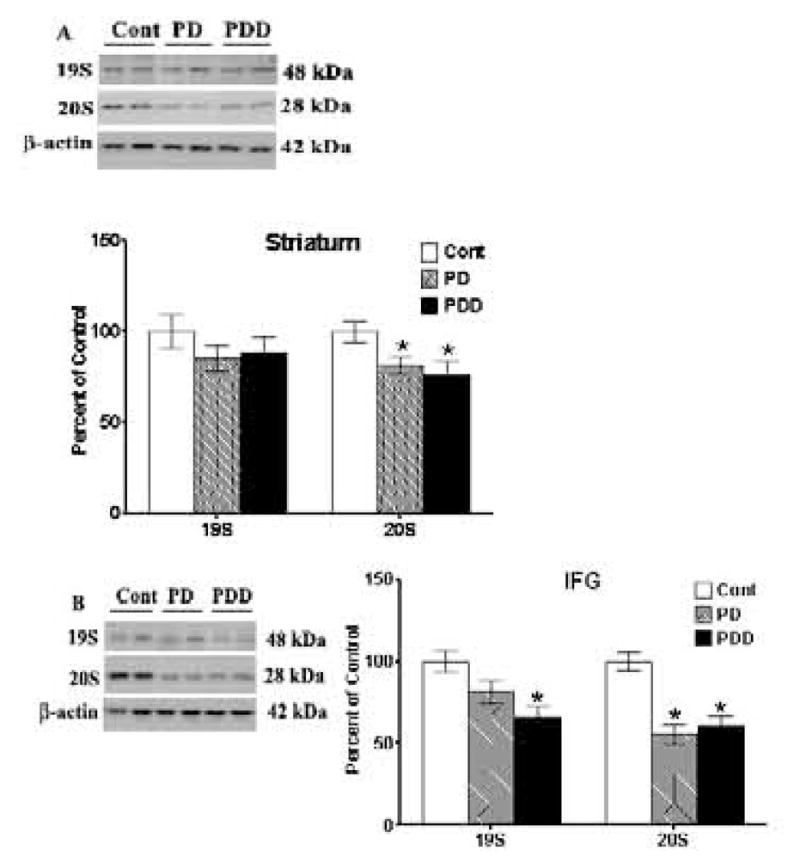
Western blot analyses of 19S and 20S proteasomal subunits were conducted using antibodies to detect these proteins. Blots are from representative experiments, while the graph is a summary of quantitation of protein levels normalized against β-actin in samples, from striata of 17 PD cases, 18 with PDD and 22 controls and IFG from 9 PD cases, 7 PDD and 9 controls.