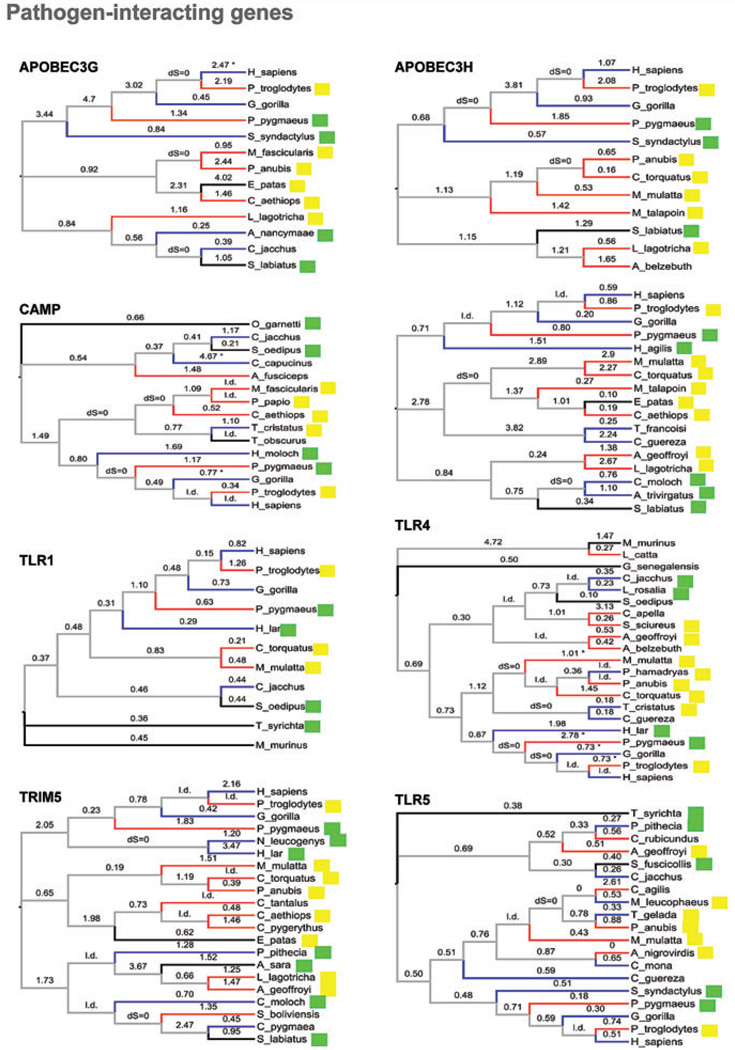
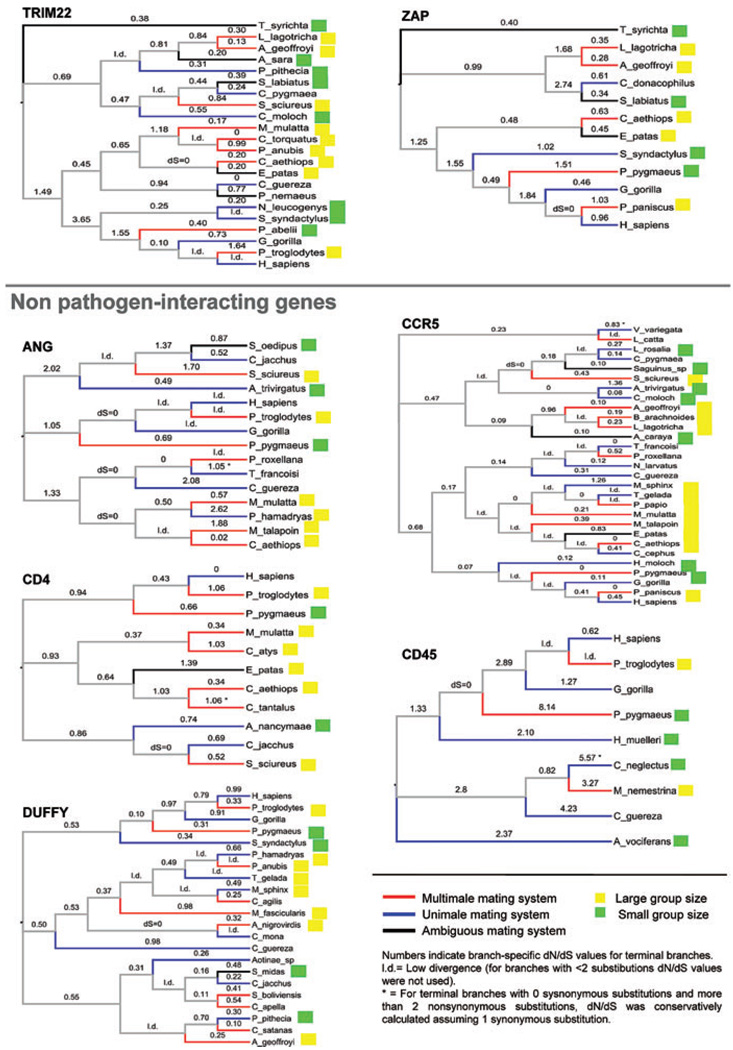
Figure 1.
Phylogenies of the 15 genes [species trees according to Purvis (1995)] showing dN/dS values (from free-ratio ML models), mating system, and group size (discretized). Branches are not to scale. Red branches indicate multimale species, blue branches indicate unimale species, and black branches represent species with ambiguous mating system. Yellow squares indicate species with large groups and green squares indicate species with small groups. l., low divergence; “dS = 0,” no synonynonymous substitutions. For the terminal branches with 0 sysnonymous substitutions and more than 2 nonsynonymous substitutions, dN/dS was conservatively calculated assuming 1 synonymous substitution. These cases are indicated with an asterix.


