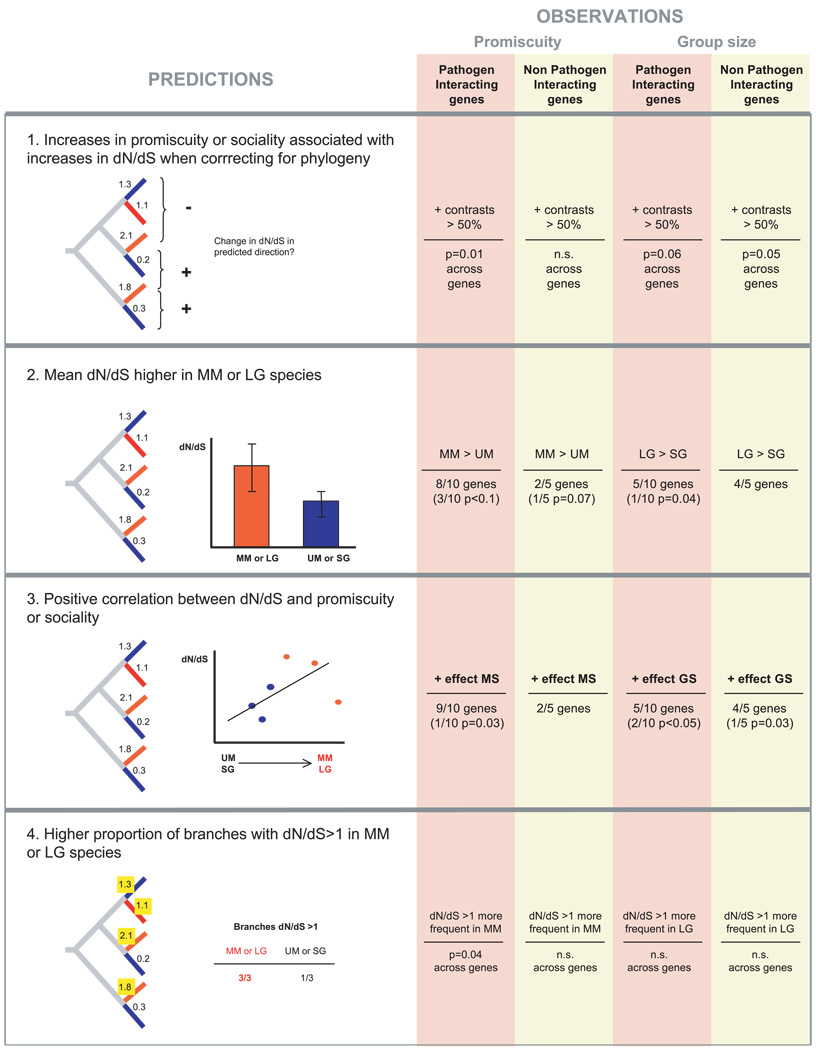
Figure 2.
Summary of tests using sexual promiscuity (residual testis size or mating system) and group size as independent variables. Red branches indicate multimale species or species with large groups, whereas blue branches represent unimale species or species with small groups. Gray branches indicate internal branches, whose dN/dS values were not used in the analyses. In panel 3 log group size was used as a continuous variable whereas in the rest of the analyses group size was discretized (see the Methods section for details). Each of the analyses is shown in detail in Tables 1–4, corresponding to panels 1–4 in this figure. MS, mating system; GS, group size; UM, unimale mating system; MM, multimale mating system; SG, small group size; LG, large group size; n.s., not significant; Panel 1. Sign tests of the number of positive contrasts [in which an increase in dN/dS is accompanied by an increase in promiscuity (MS3) or group size]. Panel 2. T-tests of differences in mean dN/dS between unimale and multimale species (or species with small groups and large groups). The right half of the figure (under OBSERVATIONS) shows the number of genes with the predicted pattern, followed by the number that are significant or marginally significant in parentheses. For example, for pathogen-interacting genes, 8/10 had higher dN/dS in MM branches than in UM branches, and 3/10 of these were marginally significant at P < 0.10. Panel 3. Multiple regressions of dN/dS as dependent variable, with promiscuity (RTS or MS3) and log group size as independent variables. Only the effects of individual variables are shown. Panel 4. Z-test of differences in the proportion of branches with dN/dS>1 between unimale and multimale species (MS3), or species with small groups and large groups.

