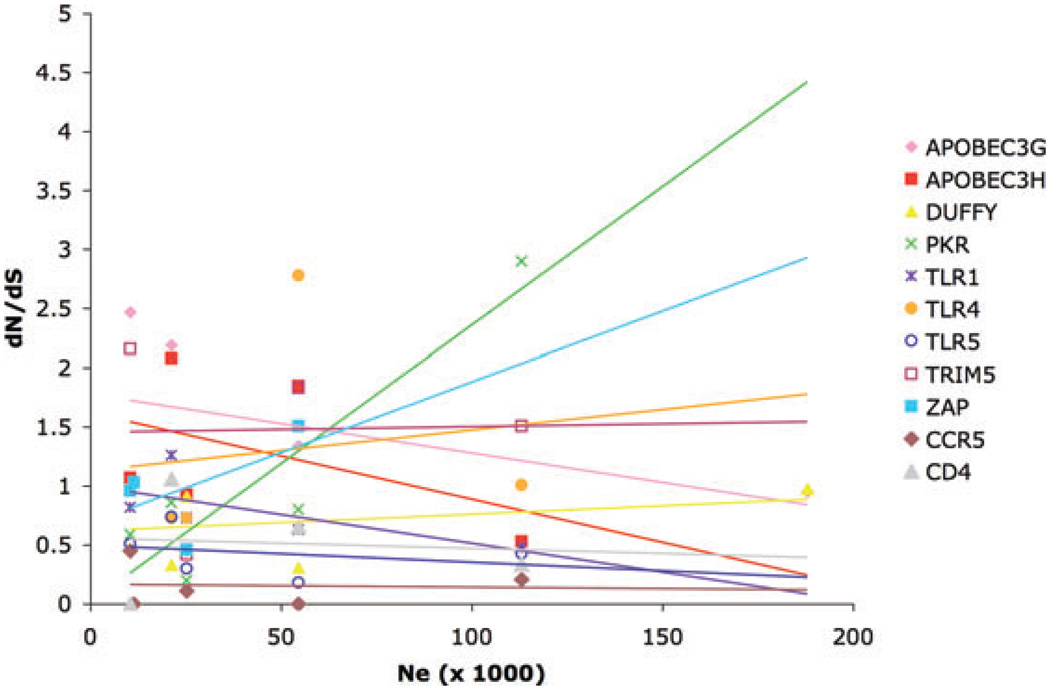
Figure 4.
Relationship between population size and dN/dS for a sample of primates that includes human, apes, and macaques. Effective population sizes were taken from the literature or calculated based on multilocus polymorphism and divergence estimates (see the section “Discussion”). Only genes with a minimum of four species with available dN/dS values were included. Regression lines are shown. None of these were significant in the expected direction (P > 0.05 for all genes except for PKR). PKR showed a positive correlation between Ne and dN/dS (R2 = 0.84, P = 0.03).

