Figure 3.
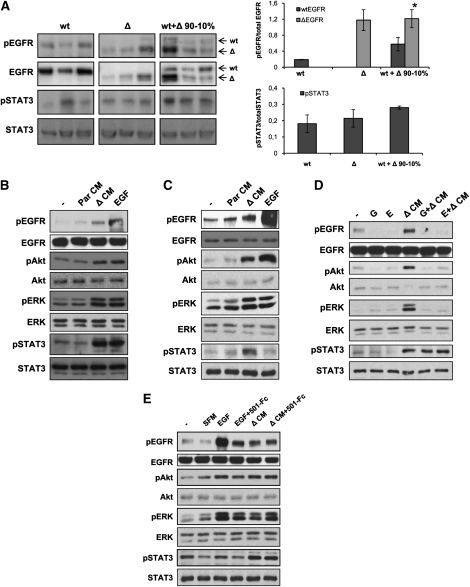
EGFR and STAT3 are activated in mixed tumors and after in vitro treatment of wtEGFR cell with ΔEGFR cell CM. (A) Analysis of EGFR and STAT3 phosphorylation by Western blot (left) and densitometry (right) of tumor lysates obtained after intracranial injection of indicated U87 cell line derivative mixtures. Every lane represents a different tumor sample. Arrows indicate wtEGFR or ΔEGFR bands. Error bars represent mean ± SEM (n = 3). Mann-Whitney U-test was used to compare results. (*) P < 0.05. (B) Western blot analysis of U87wt lysates untreated (−) or treated with 50 ng/mL EGF, or U87Par CM (ParCM) or U87Δ CM (ΔCM) showing activation of EGFR, ERK, Akt, and STAT3 pathways when treated with ΔCM. (C) Western blot analysis of mAstr-Ink4/Arf−/−-wtEGFR lysates untreated (−) or treated with mAstr-Ink4/Arf−/−-Par CM (ParCM), mAstr-Ink4/Arf−/−-ΔEGFR CM (ΔCM), or 2.5 ng/mL EGF. (D) Western blot analysis of lysates of U87wt treated with U87Δ CM (ΔCM), with or without pretreatment with 2 μM EGFR inhibitors gefitinib (G) or erlotinib (E). (E) Western blot analysis of lysates of U87wt untreated (−) or treated with serum-free medium (SFM), EGF, or U87Δ CM (ΔCM), with or without preincubation with EGFR ligand trap (501-Fc). Actin and/or total protein were used as loading controls.

