Figure 1.
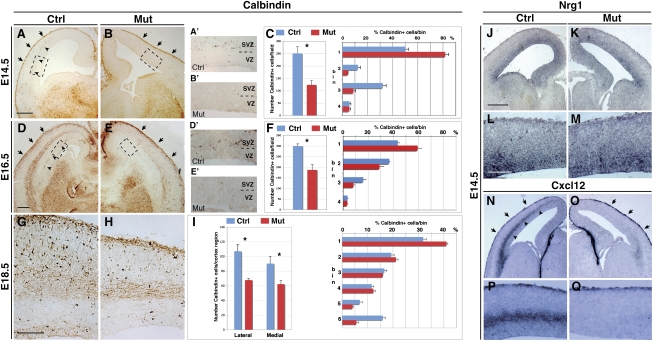
Tbr2-deficient cerebral cortices show specific loss of the interneuron SVZ migrating stream. (A,B) Calbindin+ cortical interneurons are detected in the MZ (arrows), but not in the SVZ (arrowheads), in E14.5 Tbr2 mutants, as is different from control cerebral cortices. (A′,B′) Higher magnifications of the cortical areas outlined in the boxed regions in A and B, respectively. (C) Quantification of total Calbindin+ cells (histograms indicate the total number of positive cells per field ± SEM: Ctrl, 251 ± 26.9; Mut, 123.7 ± 17; t-test < 0.001) and their respective distribution in the cortical wall (numbers in ordinate identify bins for quantification; t-test, P < 0.001; error bars indicate SEM). (D,E) At E16.5, Calbindin+ interneurons are still migrating through the deep route in the cortical SVZ/IZ in control, but not Tbr2 mutant, cortices. (D′,E′) Higher magnifications of the cortical areas outlined in the boxed regions in D and E, respectively. (F) Quantification of total positive cells per field (±SEM: Ctrl, 299.7 ± 10.8; Mut, 187.7 ± 24.9; t-test, P < 0.001) and their distribution in the cortical wall (numbers in ordinate identify bins for quantification; t-test, P < 0.001; error bars indicate SEM). (G,H) At 18.5, Calbindin+ GABAergic neurons settled in the cortex are reduced in the mutant with respect to control cortices, although their distribution was not greatly affected. (I) Quantification of the overall number of Calbindin+ cells (±SEM: Ctrl lateral, 107.2 ± 9.3; Mut lateral, 67.9 ± 2.1; Ctrl medial, 90.3 ± 9.9; Mut medial, 62.3 ± 4.8; t-test, P < 0.001) and their distribution (numbers in ordinate identify bins for quantification; t-test, P < 0.001; error bars indicate SEM). (J–M) Nrg1 expression in the ventricular zone is not altered in either Tbr2 mutant or control cortices (L,M are magnifications of J,K, respectively). (N–Q) Cxcl12 transcripts are selectively lost in the SVZ, but not MZ, cortical domain in Tbr2 mutant brains (P,Q are magnifications of N,O, respectively). Bars: A,D,J, 200 μm; G,L, 100 μm.

