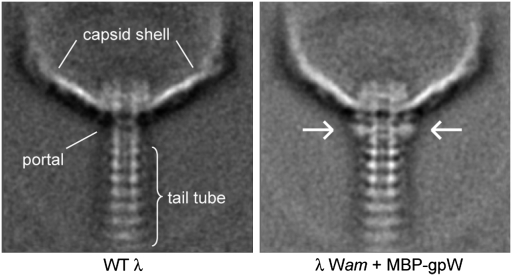
Fig. 4.
GpW is part of the connector. Averages are shown from images of negatively stained head–tail junction regions of WT λ particles (Left) and λ particles with MBP-gpW (Right) incorporated. The extra density corresponding to MBP, which shows where gpW is located, is indicated with arrows. Major structural elements are indicated on the WT image. These images were produced by averaging 280 and 300 images for the WT and MBP-gpW phage, respectively.

