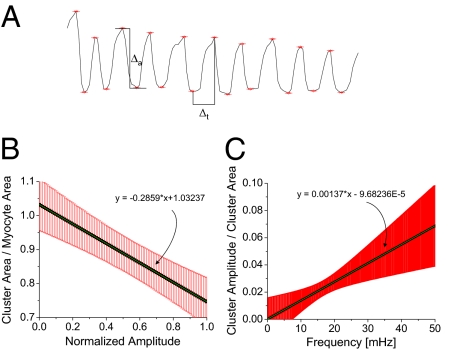
Fig. 4.
(A) Method for obtaining the amplitude of mitochondrial oscillations. After identifying the peaks of the mean TMRE signal of a major cluster of mitochondria, we determined the mean cluster area and frequency between consecutive peaks and determined the amplitude as the difference in their TMRE intensity. (B) The normalized cluster area is plotted against the oscillation amplitude values that have been normalized by the maximum amplitude value (n = 8). (C) Normalized mitochondrial cluster amplitude vs. normalized cluster area follows a linear pattern when plotted against the mean cluster frequencies (n = 6).

