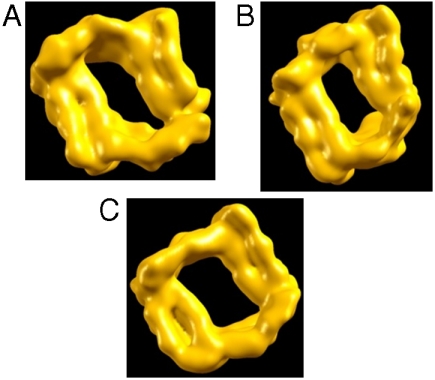
Fig. 2.
Top view of model M1 of the Aβ42 fibril at different pH values: (A) M11, at pH = 7, (B) M12, at pH = 5–6, and (C) M13, at pH = 3–4. First, the simulated models were averaged for the last 5 ns of the simulations, and then the average structures were generated from the PNAS program. The hollow core holds for all three models: Fig. 3 demonstrates the estimated dimensions of the hollow core.

