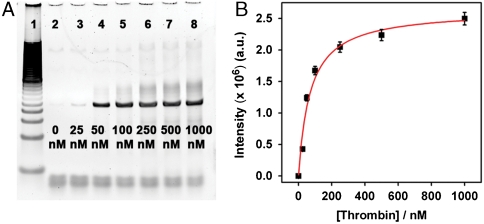
Fig. 4.
The dependence of SRA elution on thrombin concentration after 15 rounds of selection. (A) Gel image of the PCR-amplified DNA samples eluted by different concentrations of thrombin ranging from 25 nM to 1 μM (lanes 3–8). Lane 1 is 100 bp ladder, and lane 2 is selection buffer only; (B) The dissociation constant (Kd) of the selected SRA pool, calculated from the intensity of the sample bands, is 70 ± 14 nM.

