Fig. 3.
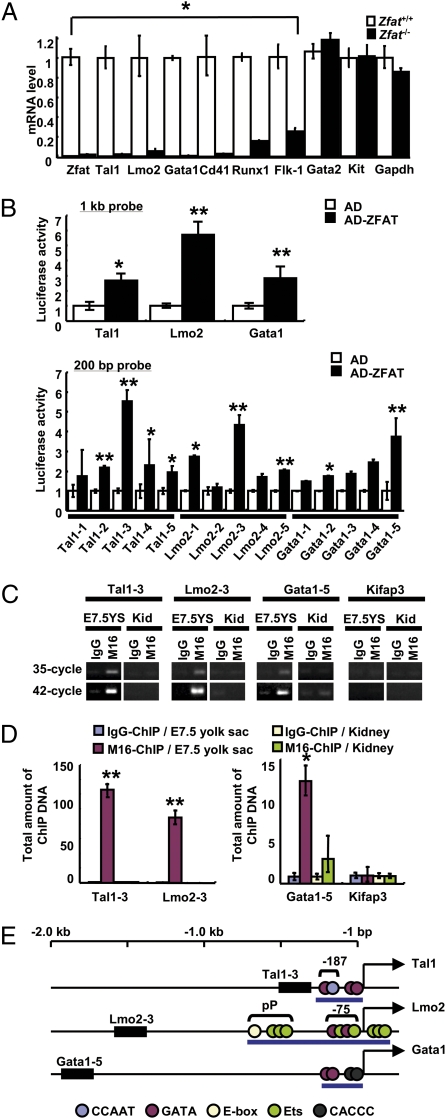
ZFAT directly regulates expressions of Tal1, Lmo2, and Gata1 genes in blood islands. (A) MicroRNA expression levels for Zfat, Tal1, Lmo2, Gata1, Cd41, Runx1, Flk-1, Gata2, Kit, and Gapdh genes in Zfat−/− (black bar) and Zfat+/+ (white bar) yolk sacs at E7.5. *P < 0.001. (B) Luciferase assay using 1-kb probes (Upper) and 200-bp probes (Lower) for detection of ZFAT-DNA binding. Activation domain (AD)-ZFAT-binding activity, black bar; AD-binding activity, white bar. *P < 0.05; **P < 0.01. (C) ChIP-PCR assay for detection of the bindings of ZFAT with the DNA elements (region for 200-bp probe in B) in yolk sacs at E7.5 and adult kidney as a control tissue. End-point PCR products at 35- and 42-cycled PCR. YS, yolk sac; Kid, kidney. (D) Quantification of ChIP DNA (region for 200-bp probe in B). Quantities of the ChIP DNA in yolk sacs at E7.5 with M16 anti-ZFAT antibody (red bar) and control IgG (blue bar). Quantities of the ChIP DNA in kidney with M16 (green bar) and control IgG (yellow bar). Bar indicates the total amount of ChIP DNA normalized by M16-ChIP DNA for Kifap3 promoter in kidney as 1.0 unit. *P < 0.05; **P < 0.01. (E) ZFAT-binding regions in the Tal1, Lmo2, and Gata1 promoters. Closed box, ZFAT binding regions; blue circle, CCAAT element; red circle, GATA binding site; yellow circle, E-box; green circle, Ets binding site; black circle, CACCC element; pP, proximal promoter; blue bar, known regulatory region for each gene expression; arrow, transcriptional start site for each gene.

