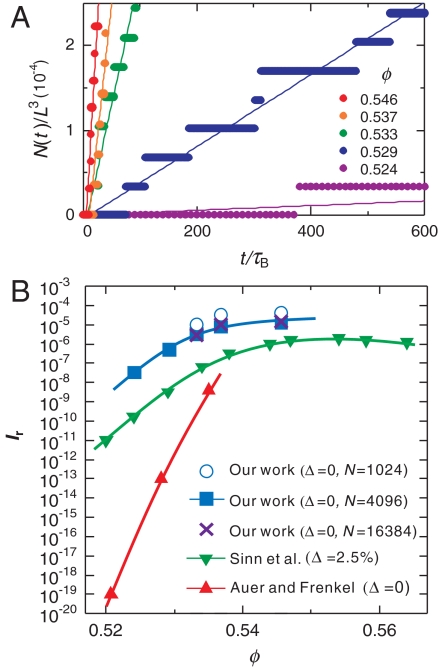
Fig. 6.
Crystal nucleation dynamics. (A) Temporal change of the number of crystal nuclei for a system of N = 4,096 (see also Supporting Information). From the rate of the increase in the number of crystal nuclei, we estimated the crystal nucleation frequency I. The numbers in the figure indicate the volume fraction ϕ. (B) The ϕ dependence of the reduced crystal nucleation frequency Ir for our work, the numerical estimate by Auer and Frenkel (15), and the experimental work by Sinn et al. (17). Curves are guides to the eye. The errors in our estimate of Ir are about the size of the symbols. We also show the results for three different system sizes (N = 1,024; 4,096; and 16,834), which indicate few finite size effects for N≥4,096. Our work almost reproduces the experimental results (17), including the ϕ dependence, i.e., the shape of the curve. The slight difference between our result and the experimental one may reflect the difference in the polydispersity between them. Here the degree of polydispersity Δ is the variance of the size distribution.

