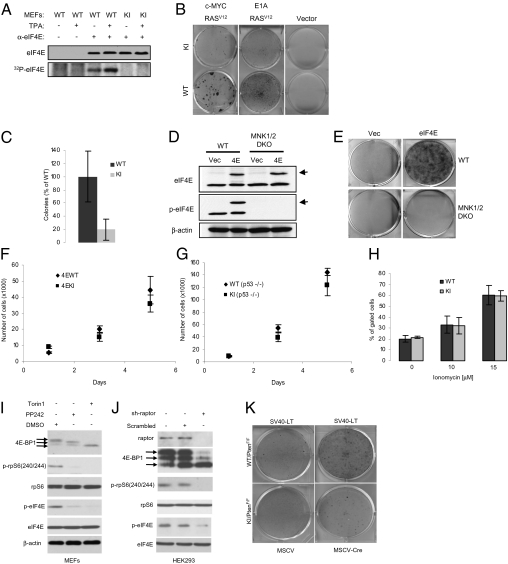
Fig. 1.
KI MEFs are resistant to malignant transformation. (A) Untreated or TPA-treated (100 ng/mL) MEFs were labeled with 32P-orthophosphate for 2 h as described in Materials and Methods. Cells were lysed and the supernatant was incubated with control (preimmune serum) or eIF4E antibody. Immunoprecipitated proteins were resolved by SDS/PAGE followed by autoradiography and Western blotting. (B) MEFs infected with the indicated retroviruses were grown on a monolayer and focus formation was determined after 10 d in culture by methylene blue staining. Similar results were obtained with eight independent pairs of MEFs. (C) WT and KI MEFs infected with c-MYC and RASV12 expression vectors were grown in soft agar and the total number of colonies consisting of more than eight cells were counted (six wells for each pair of MEFs). WT MEFs formed significantly more colonies than KI MEFs (two-tailed Student t test, P = 0.037). (D) Cell lysates from WT and MNK1/2 DKO MEFs expressing HA-eIF4E were resolved by SDS/PAGE followed by Western blotting. Arrows indicate the slower migrating band corresponding to the HA-tagged eIF4E. (E) MEFs infected with the indicated retroviruses were grown on a monolayer and focus formation was determined after 10 d in culture by methylene blue staining. (F and G) Cells (1 × 10⁵) were seeded on d 0 and counted on d 1, 3, and 5. Data points represent mean ± SD of three independent experiments. (H) Cells (1 × 10⁶) were seeded and subjected to treatment for 24 h with the indicated concentrations of ionomycin. Floating and attached cells were collected, and the double-positive Annexin V/PI subpopulation of cells was gated. No significant differences were observed between WT and KI MEFs (two-tailed Student t test: not treated, P = 0.511; 10 μM, P = 0.329; 15 μM, P = 0.952). Similar results were obtained in three independent experiments. (I) MEFs were serum starved for 6 h in the presence of vehicle (DMSO), PP242 (2.5 μM), or Torin1 (250 nM), serum-stimulated for 30 min, and the phosphorylation and levels of indicated proteins were determined by Western blotting. (J) Raptor was silenced in HEK293 cells by shRNA (sh-raptor). As a control, cells were infected with a lentivirus encoding a scrambled shRNA. Expression and the phosphorylation levels of the indicated proteins were determined by Western blotting. (K) WT/PTENF/F and KI/PTENF/F MEFs infected with the indicated retroviruses were grown as a monolayer and focus formation was determined after 10 d in culture by methylene blue staining. Similar results were obtained from two independent experiments each done in triplicate.

