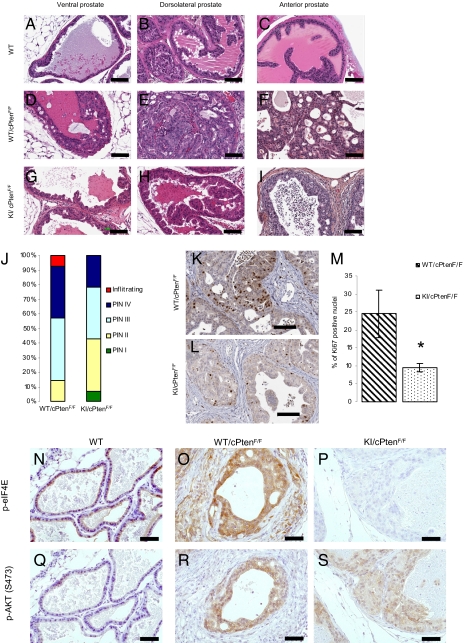
Fig. 2.
KI mice are resistant to Pten loss–induced prostate cancer. (A–I) Representative H&E staining of sections from the anterior (AP), ventral (VP), and DLP lobes of the prostate of WT, WT/cPtenF/F, and KI/cPtenF/F from 5- to 6-mo-old mice (no histological difference was observed between WT and KI mice without Cre; Fig. S3). (Scale bar: 100 μm.) (J) Histograms represent percentage of predominant lesions in a cohort of seven WT/cPtenF/F and seven KI/cPtenF/F. (K and L) Representative images of Ki67 staining of DLP sections from WT/cPtenF/F and KI/cPtenF/F mice (5–6 mo old). (Scale bar: 100 μm.) (M) Slides were scanned with the Aperio Scanscope and nuclear staining was quantified with the Image Scope software nuclear algorithm. At least 4,000 nuclei per mouse were analyzed (n = 4 mice per group). Student t test (two-tailed) was performed. (N–S) Ventral prostate sections from WT, WT/cPtenF/F, and KI/cPtenF/F mice were used for IHC with the indicated antibodies. (Scale bar: 50 μm.)

