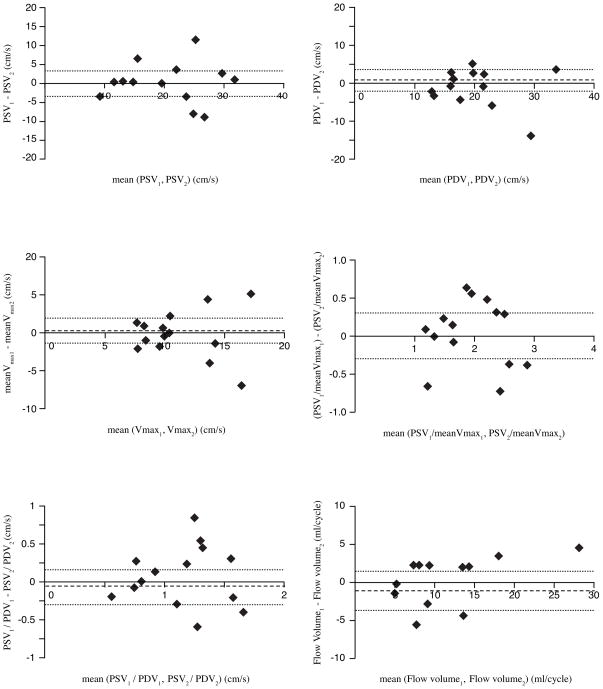
Figure 5.
Bland-Altman analysis for reproducibility of in vivo flow velocity and volume assessment: Top left: repeated assessment of PSV (peak systolic velocity); Top right: repeated assessment of PDV (peak diastolic velocity); Middle left: repeated assessment of meanVmax (maximum velocity within the defined ROI determined for each phase and averaged over the cardiac cycle); Middle right: repeated assessment of PSV/meanVmax (pulsatility of Vmax-pattern); Bottom left: repeated assessment of PSV/PDV (peak systolic and diastolic velocity); Bottom right: repeated assessment of flow volume. Mean differences are presented as dotted lines, limits of agreement (95% confidence interval) are presented as dashed lines.

