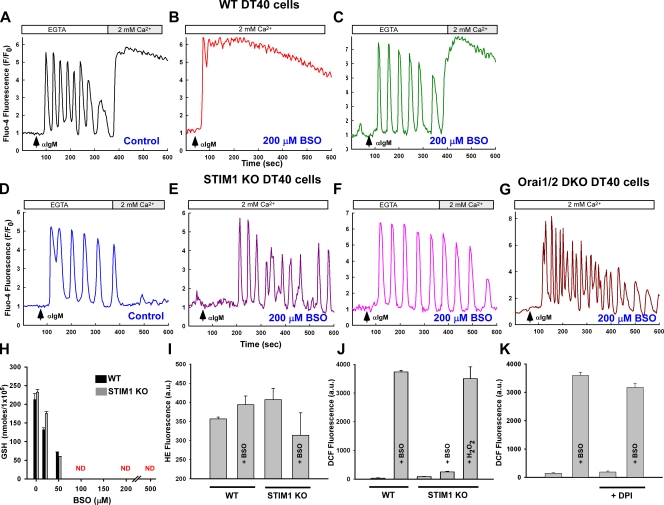
Figure 3.
Loss of the CRAC channel retains the Ca2+ oscillation phenotype during oxidative stress. DT40 cells were loaded with Fluo-4 and Ca2+ mobilization recorded after αIgM addition. Traces are representative of the typical cellular response. (A) Capacitive Ca2+ entry after αIgM mobilization. (B) Oxidative stress alters the Ca2+ mobilization pattern in WT DT40 cells. (C) Ca2+ oscillations can be restored by removal of extracellular Ca2+ (200 µM EGTA). (D) Ca2+ mobilization pattern in STIM1 KO DT40 cells is similar to WT but lack subsequent capacitive Ca2+ entry and is resistant to BSO challenge both in the presence (E) and absence (F) of extracellular Ca2+. (n = 6) (G) αIgM-evoked Ca2+ mobilization in Orai1/2 DKO cells are similar to STIM1 KO cells. (H)Total GSH levels as determined by luminol fluorescence in response to increasing concentrations of BSO for 24 h. (I) Superoxide anion production in DT40 cells as detected by hydroethidine fluorescence (HE) via confocal microscopy (n = 3). (J) Presence of the superoxide anion degradation product H2O2 via DCF fluorescence via confocal microscopy from three independent experiments (n = 3). 1 mM H2O2 was added to BSO-challenged STIM1 KO DT40 cells for 30 min as a positive control. (K) DCF fluorescence in WT DT40 cells in the presence of the NADPH oxidase inhibitor diphenyleneiodonium (DPI; 30 µM) after 20 h of BSO challenge. ND, nondetectable. Error bars indicate mean ± SEM.

