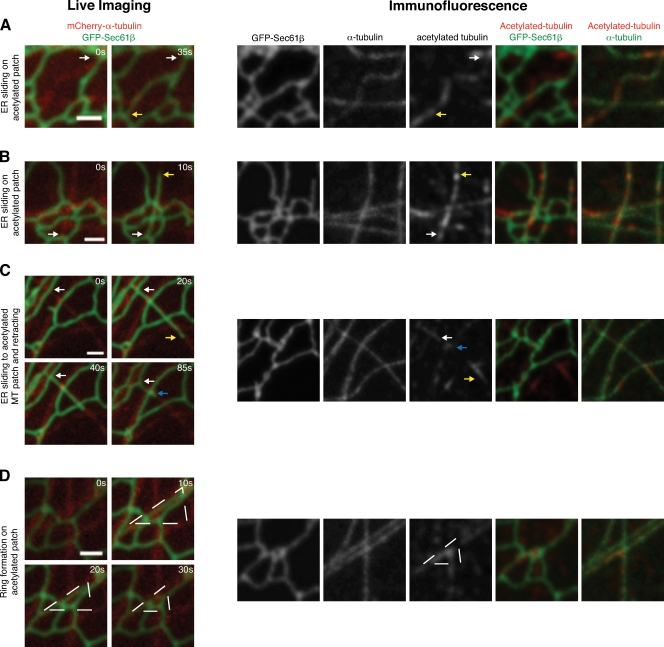
Figure 2.
Retrospective imaging demonstrates ER dynamics that occur on acetylated MTs. (A–D, left) ER sliding events were captured during live cell imaging of cells expressing GFP–Sec61-β and mCherry–α-tubulin at the times indicated (in seconds). (right) Cells were then fixed and stained with antibody to α-tubulin and acetylated α-tubulin and reimaged. Merged images are shown with the indicated colors. (A and B) Examples of ER sliding on MTs with homogeneous acetylation staining. Sliding event progression during live imaging is marked with arrows for the starting position (white) and for end position (yellow). (C) An example of ER sliding from starting position (white arrows) to a patch of acetylation (yellow arrows) and retracting to a second acetylation patch (blue arrows). (D) An example of a sliding event, followed by an ER dynamic that leads to a ring formation (dashed triangles) around an acetylated MT patch. Bars, 1 µm.

