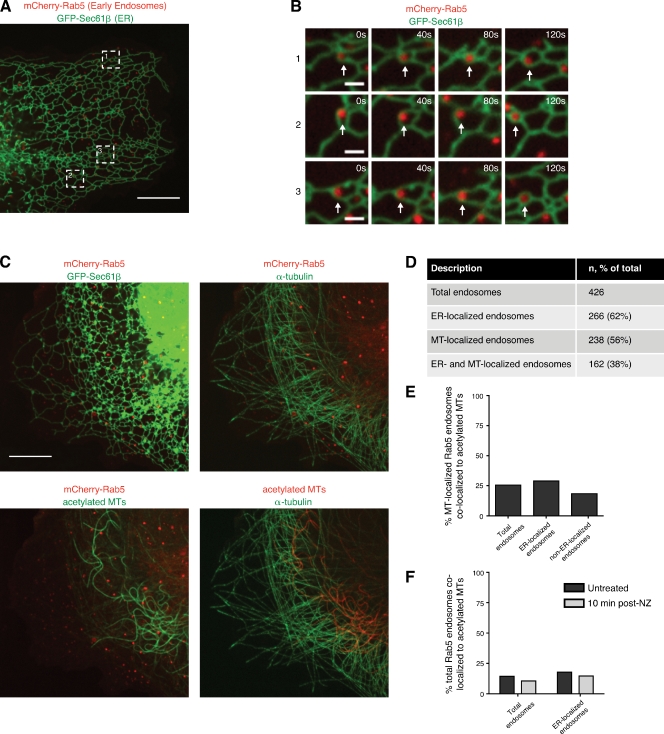
Figure 6.
Early endosomes that interact with the ER are not enriched on acetylated MTs. (A) Merged image of a COS-7 cell showing colocalization of mCherry-Rab5 and GFP–Sec61-β. Dashed boxes indicate early endosomes imaged in B. (B) Time-lapse images of ER–endosome interactions in cells expressing GFP–Sec61-β and mCherry-Rab5 at the times indicated. Arrows indicate the position of the endosome at each time point. (C) Merged images of a fixed COS-7 cell expressing GFP–Sec61-β and mCherry-Rab5 and immunolabeled for α-tubulin and acetylated α-tubulin. Images shown are merges for the indicated labels. (D) Table indicating localization of endosomes to ER and MTs. (E) Percentage of MT-localized endosomes that colocalize to acetylated MTs. Left bar is total MT localized (n = 61 of 238; 26%), middle bar is ER and MT localized (n = 47 of 162; 29%), and right bar is MT and non-ER localized (n = 14 of 76; 18%) from five cells. (F) Percentage of endosomes that colocalize with acetylated MTs before (dark gray) and 10 min after (light gray) 5 µM nocodazole (NZ) treatment. Left bars are all endosomes (untreated n = 61 of 426 [14%] from five cells; nocodazole-treated n = 47 of 443 [11%] from five cells). Right bars are ER localized (untreated n = 47 of 266 [18%]; nocodazole-treated n = 29 of 198 [15%]). Bars: (A and C) 10 µm; (B) 1 µm.

