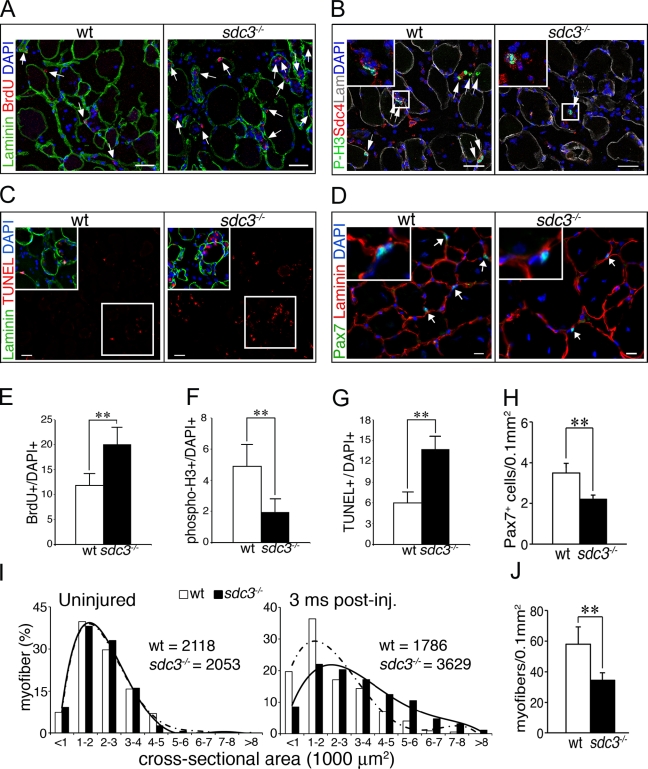
Figure 2.
Cell cycle progression and cell fate decisions are dysregulated in regenerating sdc3−/− muscles in vivo. (A–G) Proliferation is impaired in sdc3−/− SCs. Sections from wild-type TA muscles show fewer BrdU+ cells (arrows in A indicate BrdU+ cells; E shows a quantification of A), more P-H3+ cells (arrows in B indicate P-H3+ cells; F shows a quantification of B), and fewer TUNEL+ cells (C) than those from sdc3−/− TA muscles (G shows a quantification of C). (D and J) Cell fate decisions are altered in sdc3−/− SCs. The number of Pax7+ sublaminar cells (SCs) per tissue area is reduced (arrows in D indicate Pax7+ cells; H shows a quantification of D), the myofiber cross-sectional area is increased (I), and the total number of myofibers per tissue area is reduced (J) in sdc3−/− TA muscles 3 mo after injury compared with wild-type muscles. Medians of the myofiber cross-sectional area distribution for each genotype at 3 mo after injury are shown in I. Curves in I represent polynomial functions that best fit the plotted myofiber size distributions; broken line, wild type; solid line, sdc3−/−. A minimum of 1,000 myofibers and four sections per each biological replica were scored. Inset panels in B–D show enlarged views of the boxed regions. Open bars, wild type; shaded bars, sdc3−/−. Error bars indicate SEM. **, P < 0.01. Bars, 30 µm.

