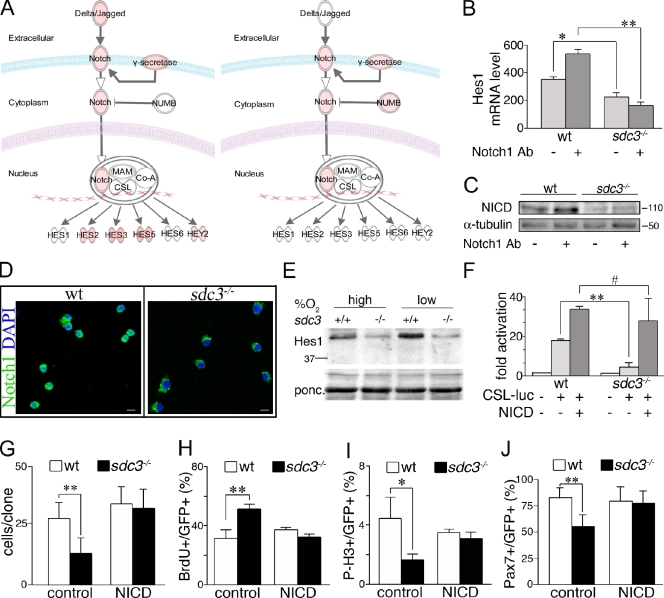
Figure 4.
Syndecan-3 is required for NICD generation. (A) Results from IPA analysis of genes differentially expressed in SCs from 12-h injured TA muscles versus uninjured TA muscles are shown for both wild-type (left) and sdc3−/− (right) mice: the intensity of the red color depicted in the figure is proportional to the relative increase in gene expression in SCs at 12 h after injury versus uninjured. Sdc3−/− SCs induce Numb at a higher extent than wild-type SCs and fail to induce Notch ligands and several Notch target genes in response to injury. (B) Sdc3−/− SCs fail to induce Hes1 mRNA when stimulated with an anti-Notch1 antibody. SCs cultured for 48 h on plates coated with a stimulating anti-Notch1 antibody were assessed by q-PCR for Hes1 mRNA (18S ribosomal RNA was used as a loading control; n = 3). (C) Western blot analysis for NICD of wild-type and sdc3−/− SCs cultured as in B shows that NICD is reduced in sdc3−/− SC extracts compared with wild-type cell extracts, and does not increase in response to Notch1 stimulation. Anti-tubulin is shown as a loading control. (D) Subcellular localization of Notch1 probed with an antibody specific to the intracellular domain of Notch1 reveals nuclear and extranuclear localization in wild-type SCs, but only extranuclear localization in sdc3−/− SCs. Bars, 10 µm. (E) Western blot analysis of Hes1 shows that Hes1 protein levels are reduced in sdc3−/− SC extracts compared with wild-type extracts and are not rescued by culturing the cells under low oxygen atmosphere. Molecular mass standards are indicated next to gel blots (kD). (F) CSL-Luc reporter activity is enhanced in wild-type and rescued in sdc3−/− SCs expressing the NICD (n = 3). (G) Ectopic expression of NICD rescues sdc3−/−-reduced expansion in culture. Wild-type and sdc3−/− SCs transfected with eGFP and either an empty vector (control) or NICD (NICD) were scored for the total number of GFP+ cells/clone 48 h after transfection (20 clones/plate scored, n = 3). (H–J) Ectopic expression of NICD rescues sdc3−/− cell cycle and cell fate phenotypes. Wild-type and sdc3−/− cultured SCs were transfected as in G. 48 h after transfection, they were scored for the number of GFP+BrdU+ cells (H), GFP+P-H3+ cells (I), or GFP+Pax7+ cells (J). Values normalized to the total number of GFP+ cells are plotted (n = 3). Open bars, wild type; shaded bars, sdc3−/−. Error bars indicate SEM. **, P < 0.01; *, P < 0.05; #, P > 0.05.

